15 Nov 2018
Behind the scenes - Integration of US crops from LCA commons into Agri-footprint
We believe that transparency is essential in the development of sustainable agri-food chains, which is why we are more than happy to give you an impression of how we work ‘behind the scenes’ and share some of our insights and experiences with you.
Therefore, this time our colleague Bart Durlinger would like to share some of our insights on the integration of US crops from LCA commons into Agri-footprint 4.0, the LCA Food Database.
Bart presented this topic during the LCA Food 2018 conference, in Bangkok.
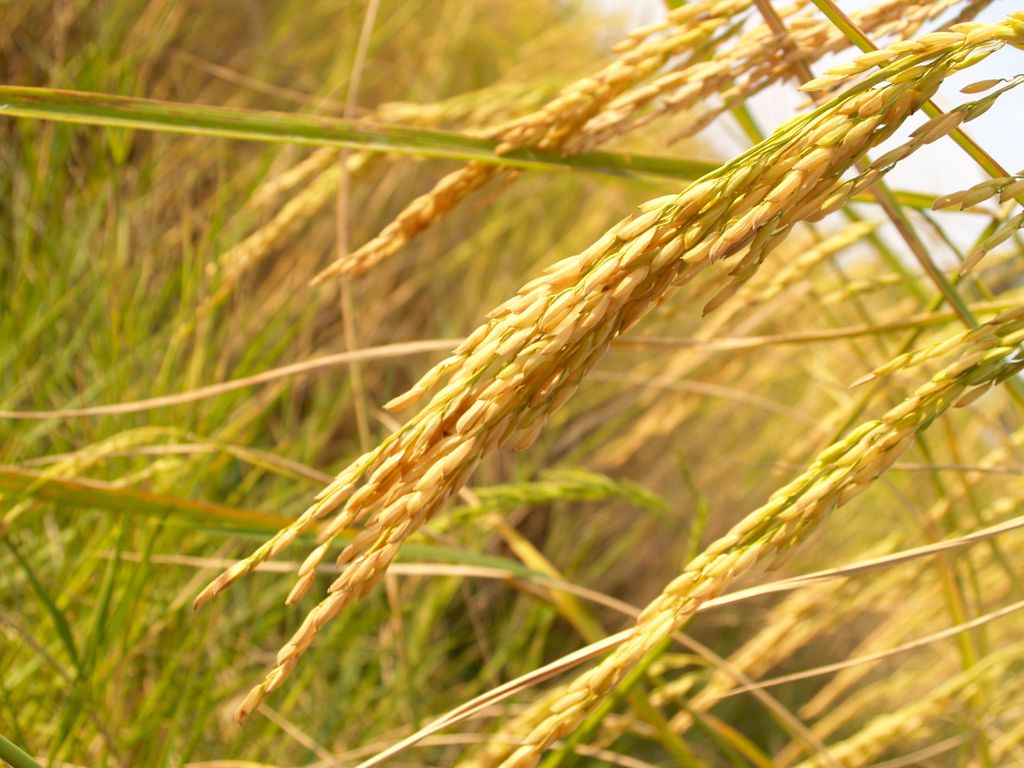
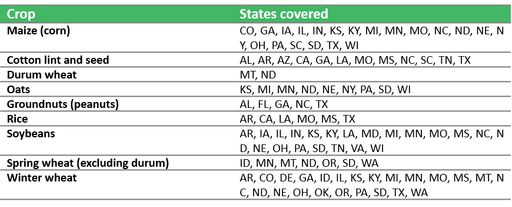
The United States Department of Agriculture (USDA) hosts a Life Cycle Assessment (LCA) data repository called the LCA commons. The aim of this repository is to support LCA researchers by providing LCA datasets related to agriculture. In 2012, Cooper et al. published the first version of the crop production dataset1. These datasets where subsequently updated and expanded2, 3, 4. The dataset contains life cycle inventory (LCI) data for cottonseed and lint, groundnuts, maize, oats, rice, soybean and winter, spring and durum wheat for the main producing states within the United States. The data is organized on a state level and is developed using survey data and statistics. In total, 117 crop products and co-products are inventoried (Table 1).
The number of datasets in the LCA commons dataset is quite large. The data is organized in unit processes with a high level of disaggregation (total number of unit processes is 36 534). Generally, over 300 processes are used to model the cradle to gate inventory of a crop product.
While this level of disaggregation provides a lot of detail on how the data is constructed, it also provides a challenge during interpretation and navigation through the dataset. Additionally, the datasets do not align well to popular life cycle impact assessment methods (LCIA methods), as not all elementary flows are tracked to their endpoints, non-standard substance names are used, and some data is missing due to the use of cut-offs. The main goal was to convert this data into a form that was useable and available to a wider audience, by including it in Agri-footprint. A number of steps were required to align the LCA commons data to the Agri-footprint data structure:
- Simplify the inventories, by aggregating some of the field activities
- Connect data to relevant background datasets, when missing
- Calculate and add relevant elementary flows
- Restructure data to align better to Agri-footprint structure

Methods
There are three main stages that were used to convert the data from its original form to the Agri-footprint format:- Extract the relevant activity data from the original database
- Transform the activity data to a similar format as the other inventories in Agri-footprint
- Load the data into Agri-footprint
More about Agri-footprint
Agri-footprint is a high quality life cycle inventory (LCI) database for the agriculture and food sector. It covers data on agricultural products: feed, food and biomass. The aim of the database is to facilitate transparency and a more rapid transformation to sustainable food supply chains.Read more
Fossil Fuel
All fossil fuel based energy inputs for field operations and irrigation were aggregated into a single input. The most dominant fuel input is diesel. As currently, there are no inventories present in Agri-footprint for combustion of natural gas, gasoline and LPG for crop production, these energy inputs were added to the input of diesel (in MJ). This is not a major cause of concern, as the ‘other’ energy inputs are relatively small compared to the diesel input. For 109 out of 117 products, the diesel input was higher than 95% of the total fossil fuel input. The relative diesel input smaller than 90% for only 3 products.Electricity was modeled using the average US grid intensity, as no state specific data is available in Agri-footprint. Technology mix and consequent emission profiles vary widely across different US regions. In the future, region specific grid inventories should be used instead.
Seed inputs
The original data specifies three different seed types (‘unspecified’, ‘GMO herbicide resistant’ and ‘Non-GMO herbicide resistant’), these were also aggregated into a single seed input.Fertilizers
The crop fertilizer inputs could not be directly linked to those available in Agri-footprint. This is mainly because the LCA commons assumes different NPK values of the fertilizer products, or that fertilizer types are used that are not available in Agri-footprint. Using a scaling factor (determined based on the most relevant nutrient component), the LCA commons fertilizer inputs are converted to Agri-footprint fertilizer inputs.Generation of inventories
The transformed activity data is then used to generate the crop inventories. The ‘Agri-footprint crop tool’ is used to generate the complete inventories. This tool was developed to generate crop inventories for the Agri-footprint databases and has been in used since Agri-footprint database version 2.0. The emissions are calculated using standard Agri-footprint calculation rules and methodology5. The process inputs are linked to already existing Agri-footprint processes (for fertilizer and pesticide productions for example).
Results
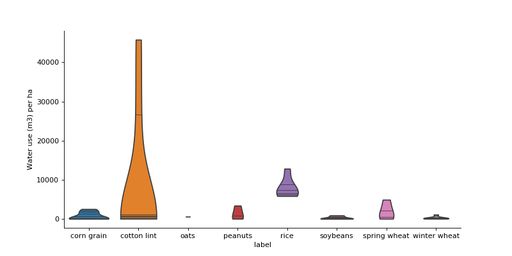
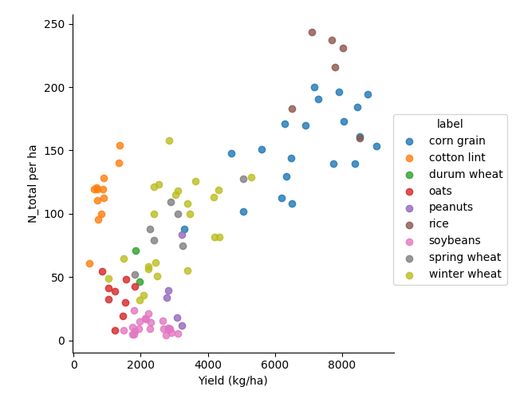
To detect potential errors, the activity data was systemically analyzed. The quantities of water used varies depending on the location and crop type (Figure 1). The water use for cotton lint can be extremely high (Cotton AZ = 46 000 m3/ha, Cotton CA = 26 000 m3/ha) (see Figure 1). Due to energy requirements for irrigation, cotton in Arizona and California also have a high input of energy.There are differences between the various crop types and their fertilizer inputs (Figure 2). Cotton has a relatively high input of nitrogen, but a relatively low yield. Conversely, soybeans receive a relatively low nitrogen input. For phosphorus and potassium inputs the relation between input quantity, and crop type and yield is less strong. Note that there are many factors that influence crop yield beyond fertilization amount, such as local climate, soil properties, farm management practices etc. Therefore, no causal relation should be inferred from these correlations.
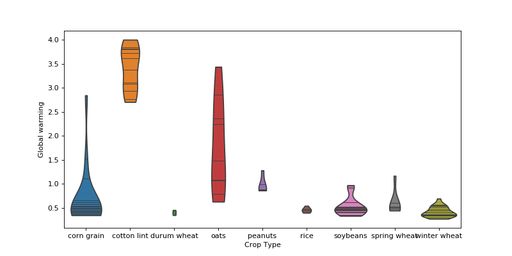
The impacts per crop type are generally grouped in a certain range. For climate change impacts (figure 3), there are some outliers for corn grain and a broader range than usual for oats.
Conclusion
With the inclusion of the LCA commons in Agri-footprint, the data are now more accessible to a wider audience. It is now also possible to assess the impact using popular impact assessment methodologies such as ReCiPe. The datasets are included in Agri-footprint 4.0 which is available in SimaPro and openLCA. This makes it easier to take US state-specific crop data into account in future LCA studies.References
1 Cooper, J. (2013). Summary of Revisions of the LCA Digital Commons Unit Process Data: field crop production (For version 1.1 August 2013) (Vol. 1).2 Cooper, J. (2015). Summary of Revisions of the LCA Digital Commons Unit Process Data : field crop production (Vol. 2).
3 Cooper, J., Kahn, E., & Noon, M. (2012). LCA Digital Commons Unit Process Data: field crop production (Vol. 1).
4 Cooper, J., Noon, M., Kahn, E., & Johnson, R. (2014). LCA Digital Commons Unit Process Data : agricultural self- propelled equipment.
5 Durlinger, B., Koukouna, E., Broekema, R., van Paassen, M., & Scholten, J. (2017). Agri-footprint 4.0 - Part 2: Description of data. Gouda, the Netherlands.
More information
We are always looking for ways to improve our background data. Any suggestions or new information is welcome.
Also, if you have any questions about double cropping in Agri-footprint, please get in touch with Bart Durlinger at
bart@blonkconsultants.nl or call +31 (0) 182 579 970.
.