
This summer, we are launching Agri-footprint 8, marking our biggest data expansion yet. When primary supplier data isn’t available, having high-quality, granular background data is essential to keep your footprint calculations precise. By expanding our database from 4,800 to 10,000 datasets Agri-footprint 8 delivers the consistent, audit-ready secondary data you need to keep your footprint calculations consistent, comparable and compliant. This major update adds over 2,600 fruit and vegetable datasets, alongside 112 new geographies, including U.S. and Australian state-level data.
In this article we focus on scope expansion, in upcoming features we will zoom in on the many methodological updates of Agri-footprint 8.
12 Jul 2026

Agri-footprint 8 is on its way
Scaling from 4,800 to 10,000 datasets
A common challenge when calculating emissions is knowing an ingredient’s country of origin but lacking the farm-level primary data to model it. While background databases are meant to fill these gaps, problems arise when they lack the specific data you need, offer non-representative options, or miss essential product categories entirely. As we explored in our recent article on the LCA data dilemma, relying on broad, less accurate proxies compromises the precision of your final footprint.
Agri-footprint 8 gives you the confidence and the data you need by significantly expanding product coverage while delivering highly granular, region-specific, and production-process-specific datasets.
What's new in Agri-footprint 8?
An expanding data library
With Agri-footprint 8, we have significantly increased the database's scope by adding 344 entirely new product categories, bringing the total to over 10,000 datasets. The chart on the right stacks our previous data next to Agri-footprint 8 so you can see exactly where we’ve added the most coverage. Hover over the bars to explore which areas have expanded the most.
Want the full list? Download the complete dataset overview using the button below.
Let's have a closer look at the scope expansion of Agri-footprint 8.
1. Fruits & Vegetables expansion
Unlocking over 2,600 specific fresh produce datasets
Historically, complex and localized fresh produce supply chains have been difficult to model due to a lack of crop-specific NPK data. Agri-footprint 8 addresses this with new NPK modeling. By adding 49 new product categories in fresh fruits & vegetables, this update features over 2,600 specific fruits & vegetables datasets and transforms the fresh produce sector into a core pillar of the database.
The expansion includes high-volume global trade fruits and vegetables, such as:
-
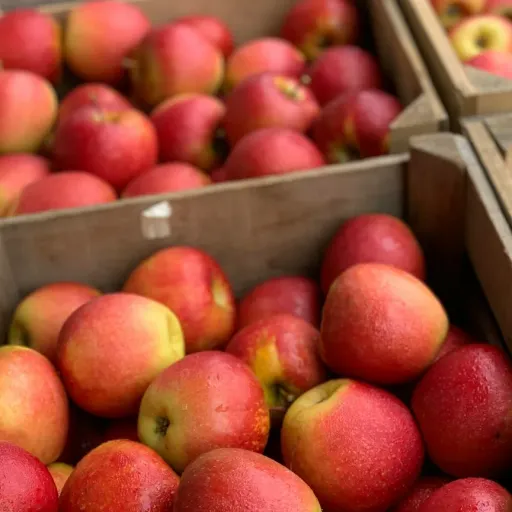
Fruits: Apples, bananas, grapefruit, grapes, kiwi fruit, melons, oranges, peaches, pears, pineapples, strawberries, and much more.
-
Vegetables: Artichokes, asparagus, cucumbers, lettuce, sweet potatoes, tomatoes, and much more.
A breakthrough in Agri-footprint is the shift from generic farming baselines to more explicit agricultural cultivation systems and growing environments coverage. The ‘at orchard’ stage captures for instance the multi-year establishment and unique resource dynamics of permanent fruit and nut trees.

With fruits like strawberries becoming available, Agri-footprint 8 makes complex, high-quality cultivation systems available for the picking.
2. Geographical expansion
From 74 to 186 unique geographical regions
In global supply chains, generic "global averages" mask the true environmental impact of localized sourcing decisions. Agri-footprint 8 introduces many new unique geographical regions, growing from 74 to 186 in Agri-footprint 8.
Use the toggle below to see the increase in geographical coverage from Agri-footprint 7 to 8. Hover over a country to see the increase of datasets.
Enhancing geographical resolution
A key driver of this expansion is the addition of state-level data for the U.S. and Australia. Instead of relying on broad national or continental averages, you can now model U.S. and Australian crop production at the state level, reflecting local cultivation realities for U.S. field crops as well as Australian horticulture like avocados, mangoes, citrus, and nuts. This allows sustainability specialists anywhere in the world to model local conditions with accuracy.
Agri-footprint 8 also introduces new country-specific baselines, across previously data-scarce sourcing regions, including countries like Ecuador, Kazakhstan, and Vietnam.

This is a major milestone for Agri-footprint. By integrating sub-national modeling, we've replaced broad national averages with precise, state-level datasets, giving you the regional specificity required for accurate footprint calculations for the U.S. agri-food sector.
3. Beef system modelling expansion
Adding 26 new beef datasets
For Agri-footprint 8, we have significantly expanded our European livestock scope, building on our existing baseline for Irish beef to include 10 distinct beef systems, resulting in 26 new beef datasets. Instead of broad country averages, Agri-footprint 8 tracks more granular animal life cycle stages, breed types, and farming intensity. This includes specialized models for suckler operations in Belgium, extensive systems in France, and intensive fattening in Italy and Germany. By distinguishing specific herd roles, such as replacement heifers, finished bulls, and dairy-born calves, you can map the exact reality and feed composition of European cattle farming. Crucially, this entire framework has been updated to the IPCC 2019 refinement parameters, ensuring the emissions reflect the latest scientific consensus.
4. Introducing Production mixes
New LCA building blocks
Agri-footprint 8 expands a powerful building block for modelling supply chains where exact farm-level origins are unknown: "production mix" datasets. These background datasets aggregate varied localized farming practices, technological variations, and regional yield groups into a statistically weighted average. When you face data gaps regarding upstream suppliers, these pre-calculated mixes provide a scientifically sound baseline that reflects the market reality of a specific region.
An example: Almonds from France
For example, if you would like to use almonds from France, but that's not available since they are not typically produced there, you could use a proxy from another country. However, a better approach would be to use a production mix for almond production for the region Europe, as it contains the weighted average of almond production in Europe.
Requirement for EU PEF methodology
Production mixes are not just a best practice; they are sometimes required by regulatory frameworks. For instance, the European Commission's PEFCR Feed methodology mandates using volume-weighted market or consumption mixes for ingredients with unknown origins. This rule prevents practitioners from "cherry-picking" low-impact single-country datasets to artificially lower their scores. If you source an ingredient like maize or soy in a feed inventory and the exact source is unknown, the PEFCR prescribes using a pre-calculated production mix rather than a single-country proxy.
How Agri-footprint 8 will benefit your work
Agri-footprint 8 is built to serve different users across the sustainability space. Whether you are building footprint models, tracking corporate emissions, or developing sustainability tools, Agri-footprint 8 ensures your footprint calculations are consistent, comparable, and aligned with frameworks like the EU PEF and GHG Protocol.
Here is how the substantial scope expansion directly benefits your work:
If you are an LCA practitioner or consultant
You get the specific regional and cultivation data allowing you to build accurate, compliant models. Moreover, the expanded datasets mean you can now model complex, multi-ingredient portfolios with precision, capturing the impact of ingredients that previously lacked data.
If you manage corporate sustainability & Scope 3 emissions
You get the data needed to make informed decisions. Better regional data means your team can actually compare the environmental impact of different sourcing locations, making corporate baselines and supplier engagement much more realistic. This allows you to scale footprinting across diverse product lines simultaneously.
If you develop sustainability software & SaaS platforms
You can scale your tool effortlessly with Agri-footprint 8. With over 10,000 high-quality datasets, your food, beverage, and retail customers will find the agri-food background data they need built right into your platform. The clean, structured database format is optimized for smooth software or platform integrations.
Stay tuned for the official release
Agri-footprint represents our continuous commitment to bringing the highest data quality, transparency, and scientific foundation to the agri-food sustainability community. To ensure data transparency and accuracy, Agri-footprint 8 undergoes an independent external review by the LCA experts of Agroscope.
Stay tuned as we approach the official release date this summer and make sure to sign up for our newsletter to get updates straight to your inbox.
Are you already curious about what Agri-footprint 8 can offer your sector or company?
Get in touch

Rory Malone
Commercial manager
Don't wait until the official launch and reach out to Rory to explore how this major data expansion can elevate your footprinting and LCA work.