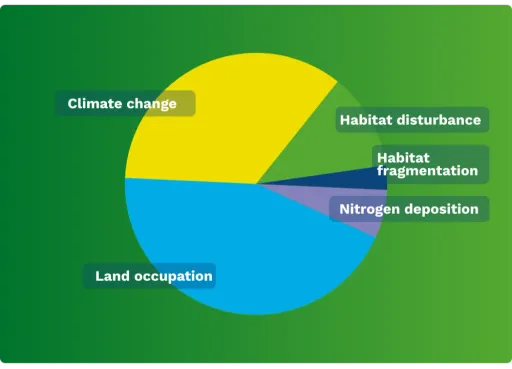
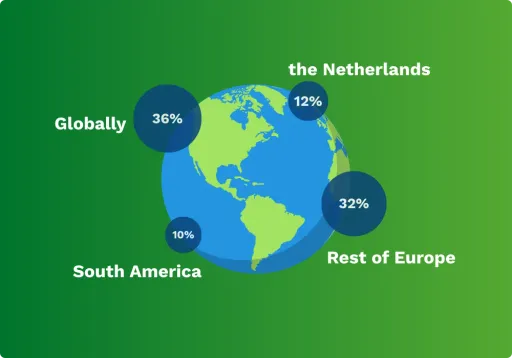
18 Aug 2025

Quantifying biodiversity loss

We integrated a biodiversity abundance indicator, Mean Species Abundance (MSA), into LCA to directly quantify how foods impact biodiversity. MSA measures how intact nature is compared to pristine conditions with a lower score indicating reduced wildlife and degraded ecosystems. By linking MSA with LCA, we can see not only how food production affects climate or pollution, but also how it contributes to biodiversity loss. This integration provides a more complete picture of food’s environmental footprint.

Measuring biodiversity footprint of Dutch diets

Results: contributors, drivers and where the impact occurs

Using Dutch national consumption surveys, the biodiversity impact of common foods in the Netherlands was assessed. Over 200 food items were analyzed. 

Biggest contributors 

The results show that the biggest contributors to biodiversity loss are: Beef, Dairy, Pork, Chicken, Coffee and Fats & Oils

Main drivers

The main drivers are: Land Occupation (44%), Climate Change (35%), Habitat Disturbance (12%), Nitrogen Deposition (6%), Habitat Fragmentation (3%). 

Nearly half of the biodiversity loss comes from land use for food production. 

Local and global impact

Importantly, the study also maps where these impacts occur. This shows that Dutch diets drive biodiversity loss both locally and globally; in regions where food is produced for export.

  • 12% of biodiversity loss happens within the Netherlands

  • 32% elsewhere in Europe

  • 10% in South America

  • And 36% at the global scale, largely driven by climate change

Future applications

This method can be adapted to other countries using national life cycle inventory data and food consumption surveys, supporting global biodiversity goals and informing national strategies to meet commitments under the Convention on Biological Diversity.

This approach aligns with EU and global biodiversity goals, providing a science-based tool to measure and reduce the biodiversity footprint of food systems. It helps policymakers, businesses, and researchers design more sustainable diets and supply chains.

Read the full study

The full publication "Linking a biodiversity abundance metric to life cycle assessment for quantifying the biodiversity footprint of Dutch diets" is now available in the Journal of Cleaner Production.

de Weert, L., van Oorschot, M., Marques, A., Batlle Bayer, L., Westhoek, H., Maaoui, M., & Blonk, H. (2025). Linking a biodiversity abundance metric to life cycle assessment for quantifying the biodiversity footprint of Dutch dietsJournal of Cleaner Production. Advance online publication. https://doi.org/10.1016/j.jclepro.2025.146081 

Questions?

Reach out

Mariem Maaoui
Freelance consultant

Reach out to Mariem if you have questions about this study, or want to know more about measuring a biodiversity footprint.